
Features
Dashboard & Reports
Easily see the data you need to see
One of the most important things you need from your church software is DATA. “Better Decisions start with Better Data”, meaning that one of the keys to managing and leading your church more effectively is Data. But Data only helps if you can access it easily and view it clearly. With the built-in Dashboard and Reports, you can quickly get access to the numbers, data, and metrics you need.
DASHBOARD
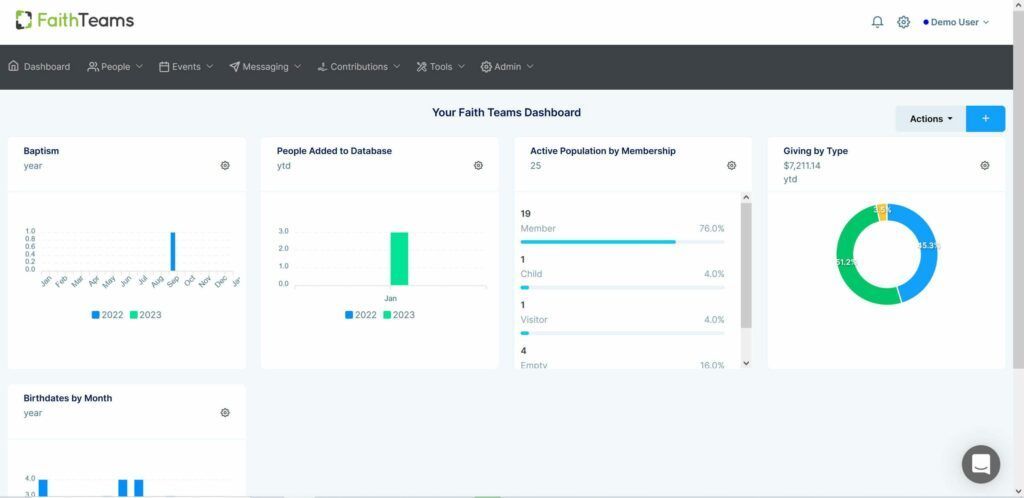
The Dashboard gives you a birds-eye view of important metrics and analytics for you and your leadership team to gain insights into your church and to help you make important decisions. Add Widgets to see the things most important to YOU.
Quickly get visuals for Attendance, Visitors, Contributions, Volunteers Serving, Birthdays, Demographics, and a lot more.
REPORTS
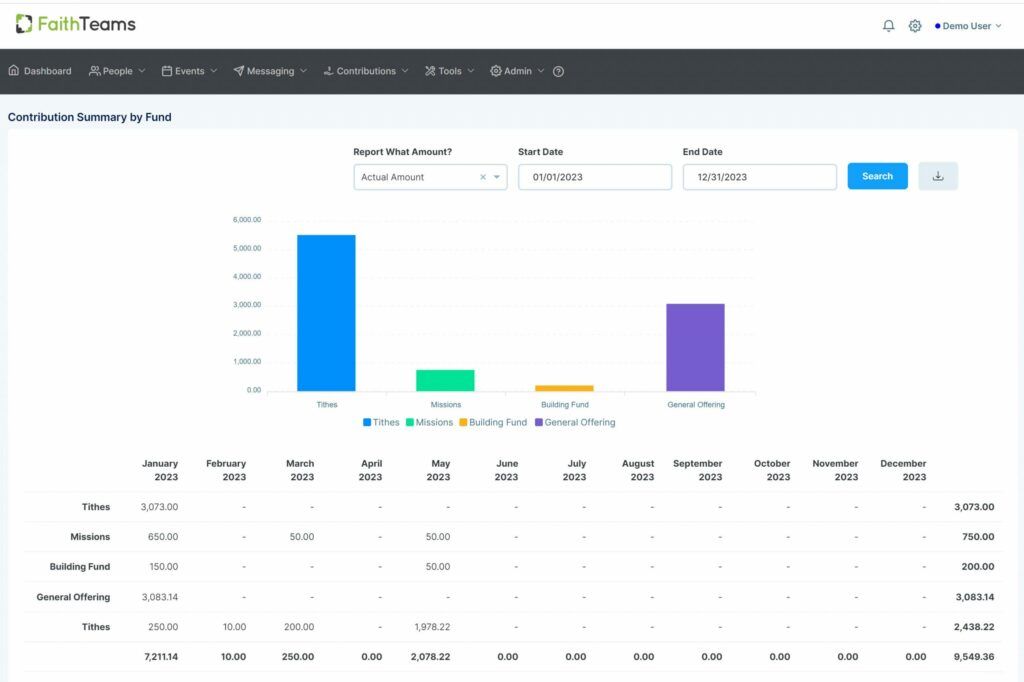
From the “Tools” menu tab, you can access clean reports and trend charts to see things like Attendance, Absentees, Visitors, Contributions, and a lot more.

Let's build the future of the Church-together.
We’re more than software. We’re your partner in ministry.